Help
Help for Database Search
The database interface will prepare a search query that selects all data sets indicated by the search criteria. Once the search criteria are selected, you can select specific attributes and analytes to display and one of three output formats: CSV, HTML or PDF for reporting the results.
Numbers/values output by the database are in U.S. format with a comma as the thousand separator. A period is used to separate the integer portion from the fractional portion of numbers.
Features and Options in the Crop Composition Database
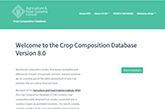
The screenshot above shows the landing page for the Crop Composition Database (CCDB). The CCDB is an open access resource owned and maintained by the Agriculture & Food Systems Institute (AFSI). The menu at the top of the landing page provides you with links to relevant information about the database. The 'About CCDB' menu includes links to 'About CCDB', 'Frequently Asked Questions', 'Help', 'How to cite this database' and 'Reference/Resource Guide'. The 'About CCDB' page provides information on the crop data included in the database, the data acceptance criteria, the data providers, analyte types, analytes, abbreviations and conversions for different units of measure, a glossary of terms and a summary of version updates. The About CCDB page also includes a link to Register for future Updates.
User Account
You have to create an account to access the compositional data. View this video to create a user account. After creating a user account, you can use the login credentials to enter the database and access compositional data.
Using Search Function to Access Compositional Data
After logging in to the CCDB, you can access the compositional data using 'Search Database' function. View this video to learn more about how to use the search function and generate reports. Users may select one of three formats for output reports - Summary Report, Detailed Report, or Tabular Report. Each of these formats can be generated in either portrait or landscape orientations, and can be displayed as a HTML, a PDF, or comma delimited file (CSV). CSV files can be transferred to Excel, SAS, MATLAB, or the R programming language for advanced statistical analyses and graphics. There is a limit of 10,000 rows for a PDF report and it is recommended that users may generate report in CSV format if the output contains more rows.
Units of Measure and Limit of Quantitation (LOQ)
The CCDB allows users to view and output compositional data in multiple units of measure, including both dry weight (DW) and fresh weight (FW) units. In addition, amino acids and fatty acids can be expressed as a relative percentage (i.e., % Total AA or % Total FA) and some nutrients (e.g., ferulic acid, p-coumaric acid) can be expressed as parts per million FW (ppm FW). Minerals are expressed as mg/kg DW and ppm FW, and calories are expressed as Kcal/100g DW and Kcal/100g FW.
All analytes in the database have been assigned a primary unit of measure, which is shown by default in the Analyte Overview Report Table. To maximize performance and simplify usage of this data preview tool, the Analyte Overview Report Table shows the composition data in the primary unit of measure. If secondary units of measure (or multiple units of measure for a single analyte) are preferred, the selection may be made accordingly for inclusion in the output report.
LOQ or Limit of Quantitation is defined as the lowest point at which a method can quantify the amount of an analyte in a sample. The Analyte Overview Report Table reports the number of samples within a search that are below the LOQ. For example, raffinose was measured in 7837 corn grain samples and 875 of the observed values for raffinose in this tissue were below the LOQ (denoted as 875<LOQ). The data that contribute to the minimum, maximum and mean values for raffinose do not include the 875 data points that are below the LOQ. LOQ meta-data can be accessed by activating the Samples below LOQ and Samples above LOQ options in the Metric Fields for Report Output.
